The presidential elections in the USA: Why did Hillary lose?
Much has been said about why Mr. Trump won and why Ms. Clinton lost the 2016 U.S. presidential elections. In this small contribution to the debate, I would like to skip the social media factor, which is being mentioned so often, and stress the geopolitical factors and the changing electorates of both of the major American parties instead.
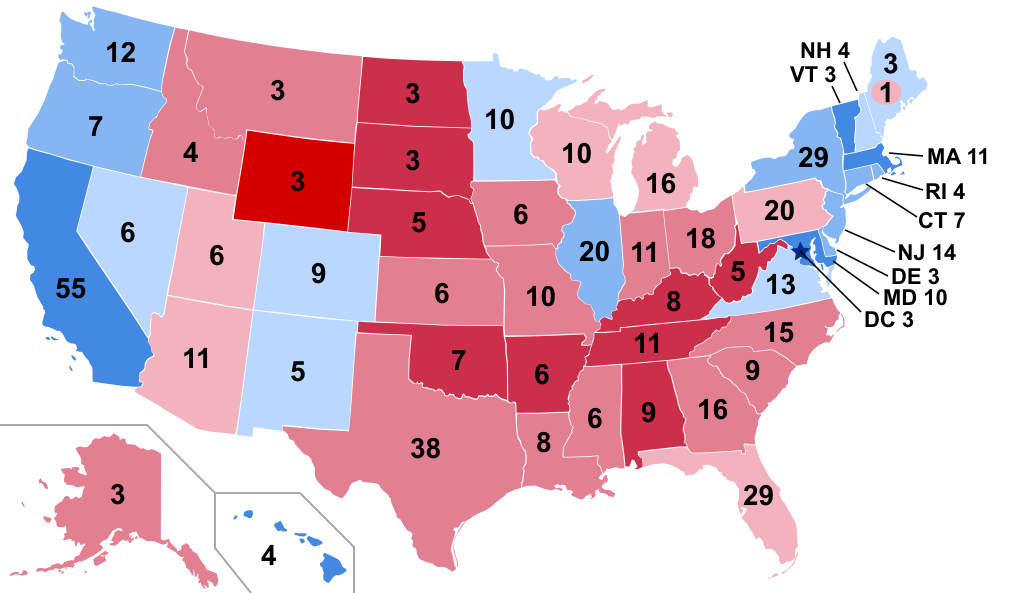
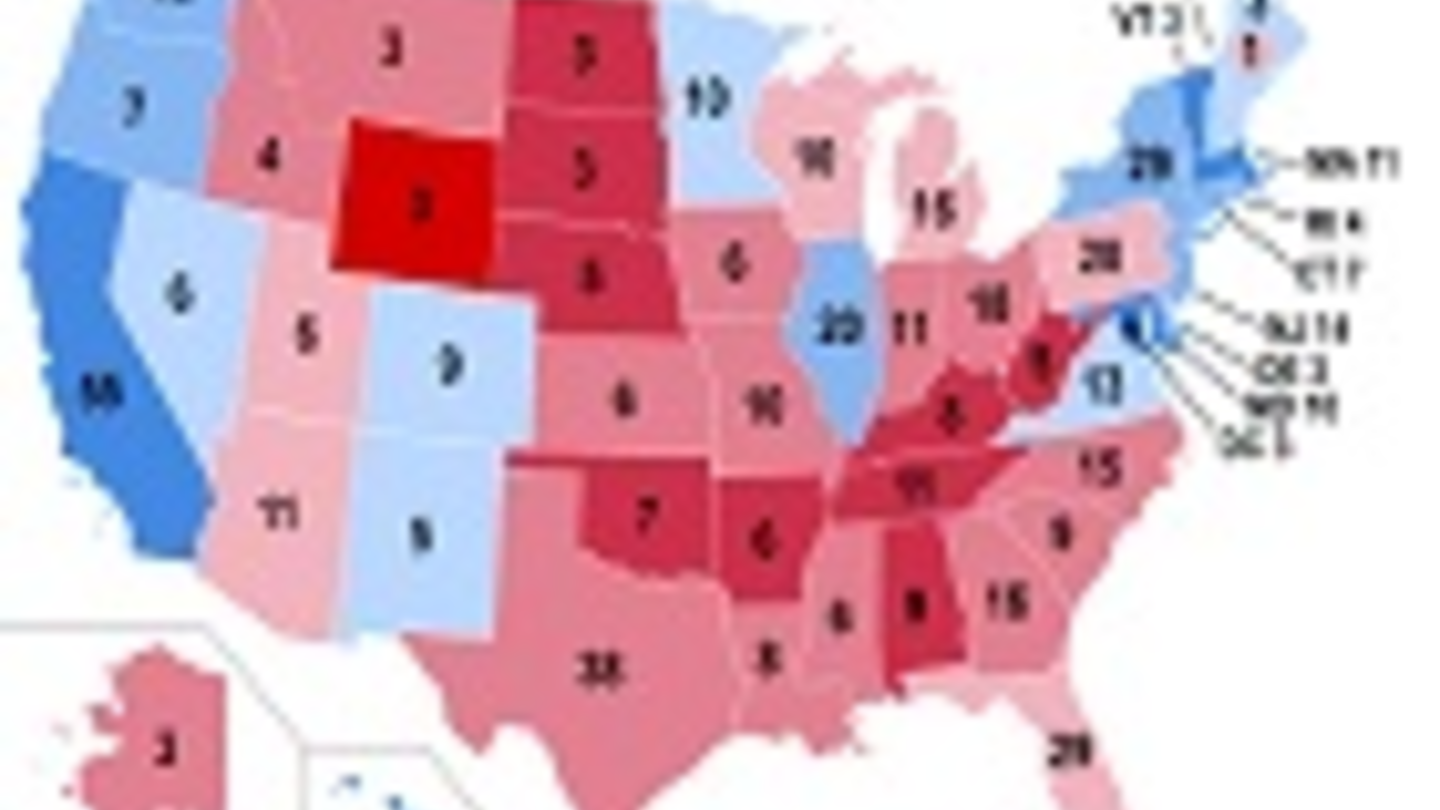
Results by state, shaded according to winning candidate's percentage of the vote. Source: Wikipedia
The election results are clear when we look at the electoral vote numbers. Donald Trump won with 306 electoral votes against Clinton’s 232. In the popular vote, however, Clinton got 62,391,335 votes against Trump’s 61,125,956. Unfortunately for Ms. Clinton, this is of no use to her and her supporters in the US presidential election system. But what do the numbers really say?
First, it shows that this year’s voter turnout was at a 20-year low in terms of the percentage of potential voters as well as in terms of real numbers: compared to the results of the previous election, the number of Hillary Clinton’s popular votes was some 3 million popular votes lower than Barack Obama’s, and Donald Trump’s number was roughly 0.5 million votes higher than Mitt Romney’s in the last elections. This leads to the question: where did the Democrats’ votes disappear to, and where did the Republicans’ additional votes come from? I will try to answer this question later.
Second, the results show wide gaps between the American voters. Some of these gaps are a historical trend: since Reagan’s almost absolute victory in 1984 no presidential candidate won by 10 million popular votes or more (the candidate who came closest to reaching that number was Barack Obama in 2008). Also, not many states changed their color on the red-and-blue map in the last 20 years. The relatively close victories in elections and minimal changes in states’ priorities in the last 20 years show a conservatism and a polarization of the ideas of many Americans.
Great gaps in values
The difference between the two groups of voters, the pro-Hillary – Democrats and the pro-Trump – Republicans, is demonstrated in a research conducted and published by the Pew Research Center. The research was done before the elections with Americans who already voted or were decided to go to cast the vote for one of the two major candidates. The research found great gaps in how the two groups see different problems, and what their values are.
John H. Kessel - Presidential Campaign Politics
nebo
Jeffrey Toobin - Too close to call : the thirty six-day battle to decide the 2000 election
Více najdete zde
The most major gaps can be seen in their views of illegal immigration. While 79 % of Trump’s voters see it as a “very big problem”, only 20 % of Clinton’s voters see it this way. On the other hand only 14 % of Trump’s voters see climate change as a “very big problem” compared to 66 % of Clinton’s voters. The gap between the rich and poor and gun violence are much more often seen as “very big problems” by Clinton’s voters as well (72 % and 73 % of Clinton’s voters, respectively, see these issues as “very big problems” as opposed to 33 % and 31 % of Trump’s voters). Great differences between the two groups (around 30 %) are also evident in their answers to questions related to terrorism, the affordability of a college education, sexism and racism. We can see similarities between them, on the other hand, in their answers to questions about drug addiction (a 6 % difference) and conditions of roads, bridges, and infrastructure (a 10 % difference).
Differences between the two groups’ values are also significant. 72 % of Trump’s voters describe themselves as “traditional” as opposed to 31 % of Clinton’s voters, 59 % of Trump’s voters, as opposed to 35 % of Clinton’s, thought that the statement “honor and duty are my core values” fit them well, and 64 % of Trump’s voters see themselves as “open-minded” as opposed to 87 % of Clinton’s. Here I would like to stress that in the phrase “honor and duty are my core values,” there is a traditional southern “Dixie” value: honor. I would also like to point out that 35 % of Trump’s voters were “interested in visiting other countries” as opposed to 56 % of Clinton’s.
The differences between the voters’ views of different social groups is even greater: 8 % of Clinton’s voters say that the views of the National Rifle Association describe them well as opposed to 69 % of Trump’s voters, 5 % of Trump’s voters see themselves as feminists as opposed to 38 % of Clinton’s, 24 % of Trump’s voters support LGBT rights as opposed to 66 % of Clinton’s, and 6 % of Trump’s voters support the Black Lives Matter movement as opposed to 53 % of Clinton’s.
With those differences in mind, when we know the thoughts of the two groups of voters, my next question is “What groups of people voted for which candidate?” Here I see differences between the voters along the lines of age, gender, ethnicity, education, locations (where the voters live) and religion.
Surprisingly, based on Alec Tyson and Shiva Maniam’s research, the gap between the old (65+ years) and young (18 to 29 years) voters is getting smaller since the 2008 elections, but still the young voters are more likely to vote for Democrats than the old voters. Based on the same research, in contrast the gap between the genders is getting bigger since the 2008 elections. Correspondingly women significantly preferred Clinton and men Trump in this year’s election.
The role of education and ethnicity
The Tyson/Maniam research also shows the historical preference of Black and Hispanic voters for Democrats, and that of Whites for Republicans. It is, however, necessary to say that this year’s Black and Hispanic priorities moved dramatically towards the Republicans by several percent – meaning further towards Trump! The answer to the question of how that is possible, in my opinion, is in the lower voter turnout caused by the changed priorities of the Democratic Party. As Democrats move closer towards LGBT and abortion rights, the oftentimes conservative Hispanic (slash Catholic) and Black voters find it harder and harder to identify themselves with the Democrats in each election. On the other hand it is hard for them (especially for Hispanic voters) to identify themselves with Trump’s controversial statements. This leads then to a low turnout among the voters from their ranks. As is demonstrated by a study conducted by Jens Manuel Krogstad and Mark Hugo Lopez, while Obama gained 67 % of the Hispanic votes in 2008 and 71 % in 2012, Clinton this year gained only 65 % of the Hispanic votes! Trump, in contrast, gained 29 % of the Hispanic votes in comparison with Romney’s 27 % in 2012 and McCain’s 31 % in 2008, showing that the number of Republican supporters among Hispanic voters has been relatively stable over the years.
The role of education in voters’ preferences changed in this year’s elections. While in previous years college-educated people and people with lower levels of education had approximately the same Republican/Democrat favor curve, the two groups moved significantly away from each other in this year’s elections, with people without a college education preferring Trump by an 8-point margin and university-educated people preferring Clinton by a 9-point margin. The main role might have been played by the populist easy-solution promises given by Trump (no global warming, “I will build the wall”, etc.), which stood in contrast against the more sober rhetoric of Clinton.
The education and ethnicity of the voters is very much mirrored by the map of county results of the elections. The dots of cities with more higher educated people or Blacks and Hispanics living there are generally blue (signifying a greater support for Clinton) on the otherwise mostly red (signifying a greater support for Trump) map of the USA. Here I would like to highlight Minnesota, in which (almost) only the Twin Cities mostly voted for the Democrats, but their votes still managed to win the whole state for the Democrats (the population of the Twin Cities area is approximately 3 million compared with the population of 5 million of the whole state). Other similar examples of such a pattern are New York, with New York City and several other bigger cities making the difference, and Nevada, with Las Vegas making the difference. An example of the opposite situation, where individual cities that voted mostly for Clinton did not manage to win the state for the Democrats, is Florida, where Miami, Tampa, Orlando and other Clinton-supporting cities did not amass together a sufficient number of votes for her.
The last but not least factor affecting this year’s election is the development of the party affiliations of various different religious groups. As we can see from Gregory A. Smith and Jessica Martínez’s research, various different Christian denominations (including Mormons) are traditionally more likely to support the Republican candidate than the Democratic one. The opposite is true for different types of Jews, religiously unaffiliated people, people of other faiths (Islam, Buddhism, etc.) and Hispanic Catholics. The shifts this year were, however, significant as the percentage of people voting for the Democratic candidate was lower than in the 2012 elections in every religious group except Jews and Mormons. The most significant losses were among white born-again/evangelical Christians (5 %), Hispanic Catholics (8 %) and other faiths as a whole (12 %!). This does not necessarily mean they switched to the Republicans, but it is more likely that many of them did not go to the polls at all.
The numbers I have shown do not indicate a major gain of votes for Trump, but rather a loss of votes for Clinton, especially among the voters who did not sympathize with Trump (or the Republicans), but also did not feel an affinity with the Democratic Party, which they perceived as too liberal. This group consists of not only Hispanic voters, but also dissatisfied blue collar workers from the suburbs, especially those from the former Manufacturing Belt.
The Rustbelt problem
The iron and coal producing and processing factories from New York to Wisconsin are mostly closed and rusting, and thousands of blue collar workers are without work. Thus this area is a Rustbelt today. For the last twenty years, blue collar workers supported the Democrats, who tried to improve their lives with various social programs. The Democrats, however, got used to the blue collar workers’ support and forgot about the sorrows of the Rustbelt. In search of votes, the Democrats moved their rhetoric closer to the various minorities of the U.S. And as a result, the Rustbelt turned more and more “red” with each election.
This year Trump promised to give back work to the people of the Rustbelt – something Clinton did not – and the Rustbelt’s support moved even closer towards the Republicans. Three of this year’s swing states were in this region: Pennsylvania (with 20 electoral votes), Ohio (18) and Michigan (16). Pennsylvania and Michigan were not Republican since 1988, and Ohio voted for the winning candidate since 1964. Both Pennsylvania and Michigan were won literally only by a couple thousand votes and put together 36 electoral votes (meaning that if Clinton won those two states she would need then only 2 more electoral votes to achieve a victory). Here we have to have in mind that Clinton – and probably the whole Democratic Party – underestimated the power of the party’s long time voters and might have moved too far to the ideological left, which might have been farther than much of the US electorate was willing to go.
Many ask themselves, “How did Donald Trump manage to win?” But I oppose the idea that Donald Trump truly won. He got only slightly more votes than Mitt Romney four years ago; I believe he managed to hold more or less the same number of the Republican electorate as Romney in the last elections and at most extended it by small numbers of conservative Hispanics and a larger number of unsatisfied blue collar workers from the Rustbelt – a trend that has been here for at least a couple of years.
I believe the outcome of this year’s election is rather that Hillary Clinton lost. She lost many of the traditional Democratic voters, many minority voters, as the most conservative parts of the minority groups cannot affiliate with the Democratic Party anymore because of its stances on LGBT and abortion rights, and blue collar workers, to whom the party did not listen anymore. Some of these former Democratic voters switched to the Republicans (e.g. the Rustbelt voters), and even more of them did not vote at all (e.g. Hispanics).
Overall, the turnout in this year’s elections was small. We should also keep in mind that this year’s elections were very close. Trump won four states (for which he received 75 electoral votes altogether) by only 1 % of the total votes, which amounted to a couple thousand votes which Ms. Clinton could have gained if she did not underestimate Mr. Trump. But who did not underestimate him, right?
About the author:
Vojtěch Jirásek is currently an intern at the IIR. He studies International Area Studies at Charles University in Prague.
Bibliography:
Heath, Brad, Thorson, Mitchell and Sergent, Jim. "How Trump changed the Obama landscape." USA Today. Accessed November 14, 2016. www.usatoday.com/pages/interactives/2016-trump-flipped-counties/
Krogstad, Jens Manuel and Lopez, Mark Hugo. "Hillary Clinton wins Latino vote, but falls below 2012 support for Obama." Pew Research Center. Accessed November 14, 2016. www.pewresearch.org/fact-tank/2016/11/09/hillary-clinton-wins-latino-vote-but-falls-below-2012-support-for-obama/
Pew Research Center. "A divided and pessimistic electorate." Pew Research Center. Accessed November 14, 2016. www.people-press.org/2016/11/10/a-divided-and-pessimistic-electorate/
Pickard, Lily. "What is the Rust Belt? Everything you need to know about the region key to winning the US election." Independent. Accessed November 14, 2016. www.independent.co.uk/news/world/americas/us-elections/rust-belt-what-is-it-us-ohio-michigan-pennsylvania-election-2016-donald-trump-hillary-clinton-a7405141.html
Smith, Gregory A. and Martínez, Jessica. "How the faithful voted: A preliminary 2016 analysis." Pew Research Center. Accessed November 14, 2016. www.pewresearch.org/fact-tank/2016/11/09/how-the-faithful-voted-a-preliminary-2016-analysis/
Tyson, Alec and Maniam, Shiva. "Behind Trump’s victory: Divisions by race, gender, education." Pew Research Center. Accessed November 14, 2016. www.pewresearch.org/fact-tank/2016/11/09/behind-trumps-victory-divisions-by-race-gender-education/
USA Today. "Elections 2016. House results." USA Today. Accessed November 14, 2016. https://elections16.usatoday.com/results/house
USA Today. "Elections 2016. Presidential results." USA Today. Accessed November 14, 2016. https://elections16.usatoday.com/results/president
USA Today. "Elections 2016. Senate results." USA Today. Accessed November 14, 2016. https://elections16.usatoday.com/results/senate
Wallace, Gregory and Yoon, Robert. "Voter turnout at 20-year low in 2016." CNN Politics. Accessed November 14, 2016. edition.cnn.com/2016/11/11/politics/popular-vote-turnout-2016/